US Obesity Rate and Statistics
Search for the US obesity rate and you’ll find 37%, 40.3%, 41.9% and 42.4% — sometimes on the same results page. All four are real, but they come from different years and different methods. This page puts every measured CDC figure in one place, for adults and kids from 1960 to the latest 2021–2023 survey, labels exactly what each number means, and lets you download the data.
40.3% of US adults had obesity (a BMI of 30 or higher) in August 2021–August 2023, the latest measured CDC data. Another 32.1% were overweight, so 72.4% of adults were above the healthy BMI range. 9.4% had severe obesity (BMI 40 or higher), and 21.1% of children and teens ages 2–19 had obesity.
Source: CDC National Center for Health Statistics, Data Brief 508; Health E-Stat 111; Health E-Stat 112 — retrieved Sep 2026.
How many Americans are obese?
About 99 million US adults had obesity in August 2021–August 2023 — 40.3% of the roughly 245 million adults ages 20 and older that NHANES represents. About 79 million more were overweight, and about 23 million had severe obesity.
Put another way, only about 1 in 4 adults (26.0%) has a BMI in the healthy range — fewer than the share with obesity alone. The typical adult is overweight: the median BMI is 28.2 for men and 28.3 for women, and the averages are 29.4 and 30.0.
Source: CDC National Center for Health Statistics, Health E-Stat 111; Health E-Stat 119; Vital and Health Statistics Series 3, No. 50 (BMI averages and medians) — retrieved Sep 2026.
| BMI category | BMI range | Share of adults | About how many |
|---|---|---|---|
| Underweight | under 18.5 | 1.6% | 4 million |
| Healthy weight | 18.5–24.9 | 26.0% (calculated) | 64 million |
| Overweight | 25.0–29.9 | 32.1% | 79 million |
| Obesity | 30.0 or higher | 40.3% | 99 million |
| …of which severe obesity | 40.0 or higher | 9.4% | 23 million |
| Overweight or obesity | 25.0 or higher | 72.4% (calculated) | 177 million |
Shares are crude (not age-adjusted) for adults 20 and older; pregnant women are excluded. Counts are calculated as share × 245.1 million adults and rounded to the nearest million. Healthy weight = 100% minus the other three categories. For weight ranges at your height, see the BMI chart; for what each category means, see BMI categories explained.
Source: CDC National Center for Health Statistics, Health E-Stat 111; Health E-Stat 119; NHANES population totals — retrieved Sep 2026.
Where do you fit?
Enter your height and weight to see your BMI category and how many US adults share it. For adults 20 and older; for children and teens, use the kids BMI calculator.
Shares from NHANES August 2021–August 2023 (adults 20+). Healthy-weight and 30.0–39.9 shares are calculated from NCHS figures. BMI doesn’t measure body fat directly — see BMI vs body fat. For your full result, use the BMI calculator.
What percentage of Americans are overweight?
32.1% of US adults were overweight in 2021–2023, meaning a BMI of 25.0 to 29.9, just below the obesity line. Add the 40.3% with obesity and 72.4% of adults have a BMI of 25 or higher. If you’ve seen claims that roughly 70–75% of Americans are overweight, this combined figure is the one that matches.
Men are more likely than women to be overweight — 35.5% vs 28.1% (age-adjusted) — while women are more likely to have severe obesity. And unlike obesity, the overweight share has barely moved in 60 years: 31.5% of adults ages 20–74 were overweight in 1960–1962 and 31.3% in 2021–2023 (age-adjusted). The healthy-weight share is what shrank.
Source: CDC National Center for Health Statistics, Health E-Stat 111 — retrieved Sep 2026.
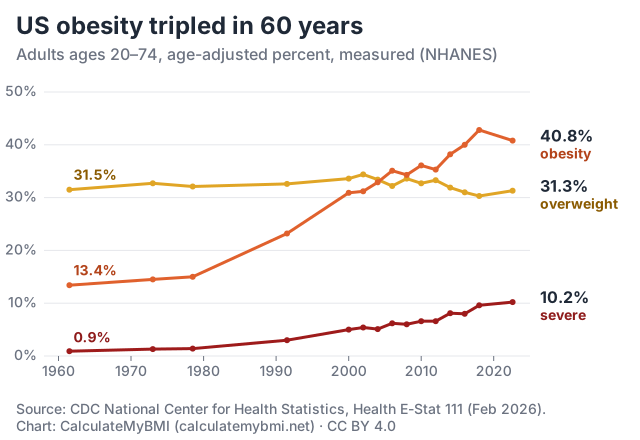
US obesity rate by year, 1960–2023
The adult obesity rate has roughly tripled since the early 1960s: from 13.4% of adults ages 20–74 in 1960–1962 to 40.8% in 2021–2023 (age-adjusted). Severe obesity grew even faster, from 0.9% to 10.2% — more than 11 times higher.
The steepest climb came between the late 1970s and 2000, when the rate doubled from 15.0% (1976–1980) to 30.9% (1999–2000). It kept rising more slowly after that and peaked at 42.8% in 2017–2018. Over the same 60 years, the share of adults with a healthy BMI fell by about half, from 51.1% to 26.2% (calculated, ages 20–74, age-adjusted).
| Survey years | Overweight | Obesity | Severe obesity |
|---|---|---|---|
| 1960–1962 | 31.5% | 13.4% | 0.9% |
| 1971–1974 | 32.7% | 14.5% | 1.3% |
| 1976–1980 | 32.1% | 15.0% | 1.4% |
| 1988–1994 | 32.6% | 23.2% | 3.0% |
| 1999–2000 | 33.6% | 30.9% | 5.0% |
| 2001–2002 | 34.4% | 31.2% | 5.4% |
| 2003–2004 | 33.4% | 32.9% | 5.1% |
| 2005–2006 | 32.2% | 35.1% | 6.2% |
| 2007–2008 | 33.6% | 34.3% | 6.0% |
| 2009–2010 | 32.7% | 36.1% | 6.6% |
| 2011–2012 | 33.3% | 35.3% | 6.6% |
| 2013–2014 | 31.9% | 38.2% | 8.1% |
| 2015–2016 | 31.0% | 40.0% | 8.0% |
| 2017–2018 | 30.3% | 42.8% | 9.6% |
| Aug 2021–Aug 2023 | 31.3% | 40.8% | 10.2% |
NHANES reports multi-year survey periods, not single calendar years. For all adults 20 and older (available from 1988–1994), obesity rose from 22.9% in 1988–1994 to a peak of 42.4% in 2017–2018 and was 40.3% in 2021–2023 (age-adjusted); both series are in the CSV below.
Source: CDC National Center for Health Statistics, Health E-Stat 111 — retrieved Sep 2026.
Use this chart or data
Free to reuse under CC BY 4.0: credit CalculateMyBMI and link to this page if you can — a nofollow link is fine. The underlying NCHS data are in the public domain.
Is obesity going down in the US?
Not in the measured data, at least not yet. The latest NHANES estimate (40.3% of adults 20 and older, age-adjusted) is below the 2017–2018 peak of 42.4%, but NCHS found no statistically significant change compared with 2017–March 2020 (41.9%) and no significant change over the decade since 2013–2014 (37.7%).
Severe obesity did rise significantly, from 7.7% in 2013–2014 to 9.7% in 2021–2023 (age-adjusted). And adult obesity remains above the federal Healthy People 2030 target of 36.0%.
A self-reported survey tells a different story. The Gallup National Health and Well-Being Index, which asks adults 18 and older to enter their own height and weight online, put obesity at 39.9% in 2022 and 37.0% in 2025. Gallup notes that self-reported figures tend to run lower than measured ones. Because the methods, ages and years differ, the two series can’t be compared point for point — whether measured obesity is falling won’t be known until NCHS publishes results from its next NHANES cycle (2025–2027).
| Survey years | Obesity | Severe obesity |
|---|---|---|
| 2013–2014 | 37.7% | 7.7% |
| 2015–2016 | 39.6% | 7.7% |
| 2017–March 2020 | 41.9% | 9.2% |
| Aug 2021–Aug 2023 | 40.3% | 9.7% |
Source: CDC National Center for Health Statistics, Data Brief 508 — retrieved Sep 2026.
Obesity rate by age, gender and education
By age: highest in middle age
Adults ages 40–59 have the highest obesity rate: 46.4%, significantly above ages 20–39 (35.5%); the rate at 60 and older is 38.9%. The same middle-age peak shows up in men and in women.
Men vs women
Women and men have similar obesity rates — 41.3% vs 39.2%, a difference NCHS found not statistically significant. The gap is in the heaviest group: 12.1% of women have severe obesity versus 6.7% of men. Men, meanwhile, are more often overweight (35.5% vs 28.1%, age-adjusted).
| Age | All adults | Men | Women |
|---|---|---|---|
| 20–39 | 35.5% | 34.3% | 36.8% |
| 40–59 | 46.4% | 45.4% | 47.4% |
| 60 and older | 38.9% | 38.0% | 39.6% |
| All 20 and older | 40.3% | 39.2% | 41.3% |
By education
Adults with a bachelor’s degree or more have a lower obesity rate (31.6%) than those with some college (45.0%) or a high school diploma or less (44.6%). The same pattern appears in men (31.1% vs 43.0% and 43.3%) and in women (31.9% vs 46.9% and 46.0%).
Source: CDC National Center for Health Statistics, Data Brief 508; Health E-Stat 111 — retrieved Sep 2026.
Obesity rate by race and ethnicity
Age-adjusted obesity rates in 2021–2023 were highest among non-Hispanic Black adults (52.1%) and lowest among non-Hispanic Asian adults (13.1%). Rates were 48.0% for Mexican American adults, 44.0% for Hispanic adults overall and 39.3% for non-Hispanic White adults. The Black–White gap is wider among women: 56.0% of non-Hispanic Black women had obesity, compared with 40.4% of non-Hispanic White women.
Two cautions from NCHS: at a given BMI, body fat varies by race and Hispanic origin — health risks may begin at a lower BMI among Asian people, and BMI may overestimate body fat among Black people. And the 2021–2023 survey did not oversample by race and Hispanic origin, so some estimates are less precise than in earlier cycles.
| Group | All | Men | Women |
|---|---|---|---|
| Asian, non-Hispanic | 13.1% | 17.8% | — * |
| Black, non-Hispanic | 52.1% | 47.3% † | 56.0% |
| White, non-Hispanic | 39.3% | 38.3% | 40.4% |
| Hispanic | 44.0% | 43.6% | 44.6% |
| Mexican American | 48.0% | 44.2% | — * |
* Not shown: the estimate does not meet NCHS standards of reliability. † NCHS refers readers to Ogden et al. (2025) for discussion of 2021–2023 race and Hispanic-origin estimates.
Source: CDC National Center for Health Statistics, Health E-Stat 111 — retrieved Sep 2026.
What percentage of Americans are morbidly obese?
9.4% of US adults have severe obesity, the NCHS term for a BMI of 40 or higher; CDC also calls this class 3 obesity. That’s about 23 million adults (calculated).
Severe obesity is nearly twice as common in women (12.1%) as in men (6.7%), and women’s rate is higher in each age group. It’s most common at ages 40–59 (12.0%, vs 9.5% at 20–39 and 6.6% at 60 and older). Over 60 years it rose from 0.9% to 10.2% of adults ages 20–74 (age-adjusted), the fastest-growing of the BMI groups NCHS tracks.
| Age | All adults | Men | Women |
|---|---|---|---|
| 20–39 | 9.5% | 6.1% | 13.0% |
| 40–59 | 12.0% | 9.2% | 14.7% |
| 60 and older | 6.6% | 4.3% | 8.4% |
| All 20 and older | 9.4% | 6.7% | 12.1% |
Source: CDC National Center for Health Statistics, Data Brief 508; Health E-Stat 111 — retrieved Sep 2026.
Childhood obesity rate in America
21.1% of US children and teens ages 2–19 had obesity in August 2021–August 2023, including 7.0% with severe obesity; another 15.1% were overweight. That’s about 15.8 million kids (calculated).
Obesity is lowest in young children: 14.9% at ages 2–5, versus 22.1% at 6–11 and 22.9% at 12–19. The rate was 23.0% among boys and 19.1% among girls. The long-run rise is steep — in 1971–1974, 5.2% of kids had obesity, about a quarter of today’s rate.
Children are classified differently from adults. Obesity means a BMI at or above the 95th percentile for their age and sex on the CDC growth charts, and severe obesity means 120% of that 95th-percentile value or more. Use the kids BMI calculator to see where a child falls.
| Group | Obesity | Severe obesity | Overweight |
|---|---|---|---|
| All ages 2–19 | 21.1% | 7.0% | 15.1% |
| Boys | 23.0% | 7.8% | 13.0% |
| Girls | 19.1% | 6.3% | 17.5% |
Source: CDC National Center for Health Statistics, Health E-Stat 112; NHANES population totals — retrieved Sep 2026.
How the CDC measures obesity
Every rate on this page comes from the National Health and Nutrition Examination Survey (NHANES), run by CDC’s National Center for Health Statistics, which calls it the primary source of body measurement information for the US population. Trained technicians measure height and weight in mobile examination centers instead of asking people, and results are weighted to represent the civilian, non-institutionalized population. Pregnant women are excluded. The 2021–2023 adult obesity estimates are based on 5,929 examined adults.
Two terms matter when you compare numbers:
- Crude (unadjusted)
- The actual share of adults in each group. Used for the current snapshot on this page: 40.3% obesity, 32.1% overweight, 9.4% severe obesity.
- Age-adjusted
- Reweighted to the age mix of the 2000 US population, so different years and groups can be compared fairly as the population ages. Used for trends and race and ethnicity: 40.3% obesity, 31.7% overweight and 9.7% severe obesity in 2021–2023.
Other limits: BMI doesn’t measure body fat directly or show where fat is carried (see BMI vs body fat), and the examination response rate in 2021–2023 was 25.6%; NHANES survey weights include adjustments for nonresponse.
Source: CDC National Center for Health Statistics, Health E-Stat 111; Data Brief 508; Series 3, No. 50 — retrieved Sep 2026.
Frequently asked questions
What is the average BMI in America?
The average BMI of US adults 20 and older was 29.4 for men and 30.0 for women in August 2021–August 2023, and the median (middle) value was 28.2 for men and 28.3 for women. In other words, the typical American adult has a BMI in the overweight range (25.0–29.9). Source: NCHS Series 3, No. 50.
Is it true that 70% of Americans are obese?
No. 40.3% of US adults have obesity (a BMI of 30 or higher). The roughly 70% figure matches adults who are overweight or obese: 72.4% had a BMI of 25 or higher in 2021–2023.
Is it true that 40% of Americans are obese?
Yes. The latest measured CDC data put adult obesity at 40.3% in August 2021–August 2023, or about 99 million adults ages 20 and older.
Why do some sources say 42.4% or 41.9%?
Those are earlier NHANES results: 42.4% for 2017–2018 and 41.9% for 2017–March 2020 (both age-adjusted, adults 20 and older). Some widely cited pages still show them; the latest figure is 40.3% for August 2021–August 2023.
What age group has the highest obesity rate?
Adults 40–59: 46.4% had obesity in 2021–2023, compared with 35.5% at ages 20–39 and 38.9% at 60 and older.
Are women more obese than men?
Only at the heaviest end. Obesity rates are similar (41.3% of women vs 39.2% of men, not a statistically significant difference), but severe obesity is nearly twice as common in women: 12.1% vs 6.7%.
What percent of Americans weigh over 300 pounds?
Fewer than 5% of adults. In 2021–2023, 95% of US men weighed 290.6 lb (131.8 kg) or less and 95% of women weighed 262.7 lb (119.2 kg) or less, so under 5% of either sex weighs 300 lb (136 kg) or more. NCHS doesn’t publish an exact 300-lb share. Source: NCHS Series 3, No. 50.
What percentage of Americans are a healthy weight?
About 1 in 4. In 2021–2023, 26.0% of adults had a BMI of 18.5 to 24.9 (calculated as 100% minus the underweight, overweight and obesity shares). In 1960–1962, about half of adults ages 20–74 did (51.1%, calculated, age-adjusted).
Sources, data and methodology
Every number on this page is transcribed from the primary publication listed below and cross-checked against overlapping NCHS tables. Values marked “calculated” are ours; the formulas are shown here and in the CSV.
- Fryar CD, Afful J, Saif NT. Prevalence of overweight, obesity, and severe obesity among adults age 20 and older: United States, 1960–1962 through August 2021–August 2023. NCHS Health E-Stat 111. February 2026.
- Emmerich SD, et al. Obesity and severe obesity prevalence in adults: United States, August 2021–August 2023. NCHS Data Brief No. 508. September 2024.
- Noiman et al. Prevalence of overweight, obesity, and severe obesity among children and adolescents ages 2–19 years: United States, 1963–1965 through August 2021–August 2023. NCHS Health E-Stat 112. February 2026.
- Ansai et al. Prevalence of underweight among children, adolescents, and adults: United States, 1960–1962 through August 2021–August 2023. NCHS Health E-Stat 119. June 2026.
- Fryar CD, Gu Q, Afful J, Carroll MD, Ogden CL. Anthropometric reference data for children and adults: United States, August 2021–August 2023. Vital and Health Statistics, Series 3, No. 50. June 2025.
- National Center for Health Statistics. NHANES population totals, August 2021–August 2023 (American Community Survey 2021).
- Gallup. Obesity Rate Declining in U.S. Gallup National Health and Well-Being Index. October 28, 2025.
- CDC. Adult BMI categories.
How we calculated
- Healthy-weight share, 2021–2023
- 100% − 1.6% underweight − 32.1% overweight − 40.3% obesity = 26.0% (adults 20+, crude).
- Healthy-weight share, 60-year change
- 1960–1962: 100 − 4.0 − 31.5 − 13.4 = 51.1%. 2021–2023: 100 − 1.7 − 31.3 − 40.8 = 26.2% (ages 20–74, age-adjusted).
- Overweight or obesity
- 32.1% + 40.3% = 72.4%.
- Obesity below the severe range (BMI 30.0–39.9)
- 40.3% − 9.4% = 30.9%.
- Counts
- Share × 245.1 million adults 20+ (or 74.9 million children 2–19), from NHANES population totals; rounded. Shares exclude pregnant women, so counts are approximate.
- Ratios
- Obesity 40.8 ÷ 13.4 = 3.0×; severe obesity 10.2 ÷ 0.9 = 11.3×; children 21.1 ÷ 5.2 = 4.1×.
Latest data: NHANES August 2021–August 2023, published by NCHS between September 2024 and June 2026. Our chart and CSV: CC BY 4.0. NCHS data: public domain.